
24 Hours
48 Hours
72 Hours
96 Hours
120 Hours
144 Hours
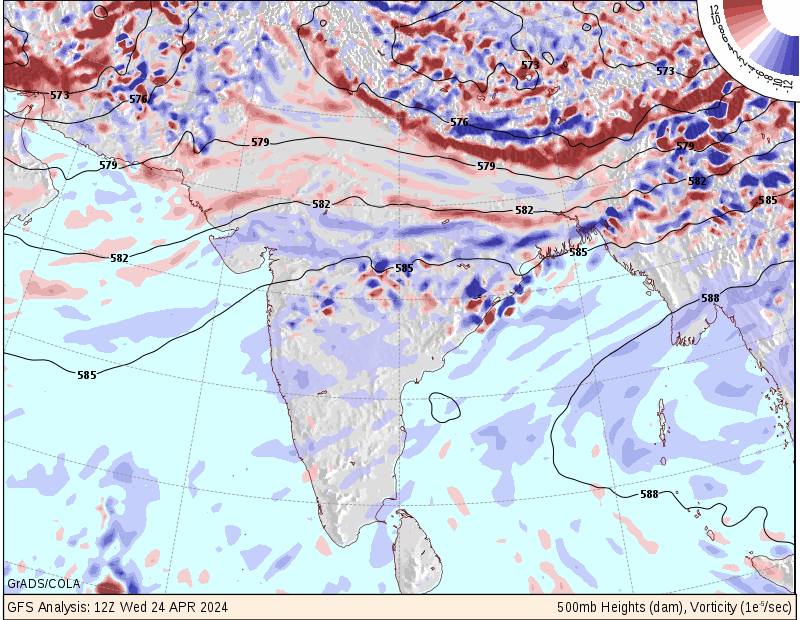
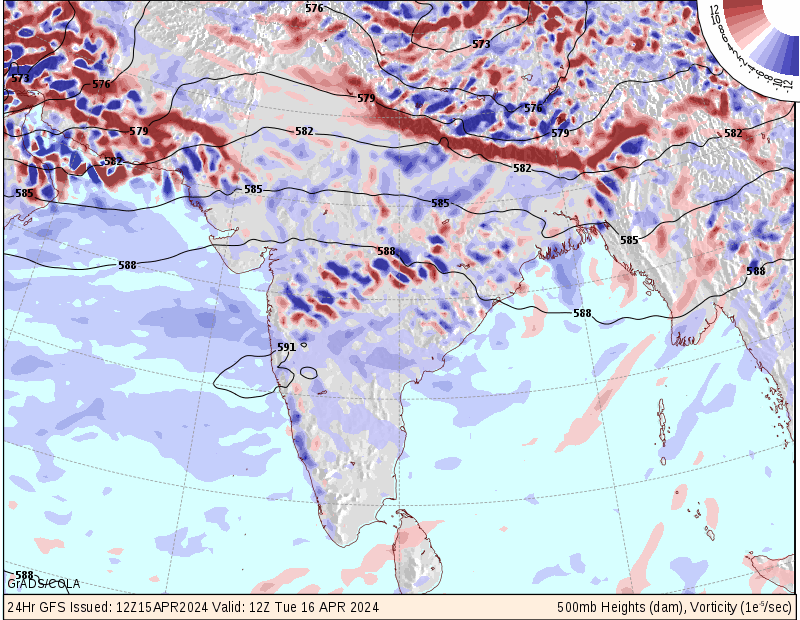
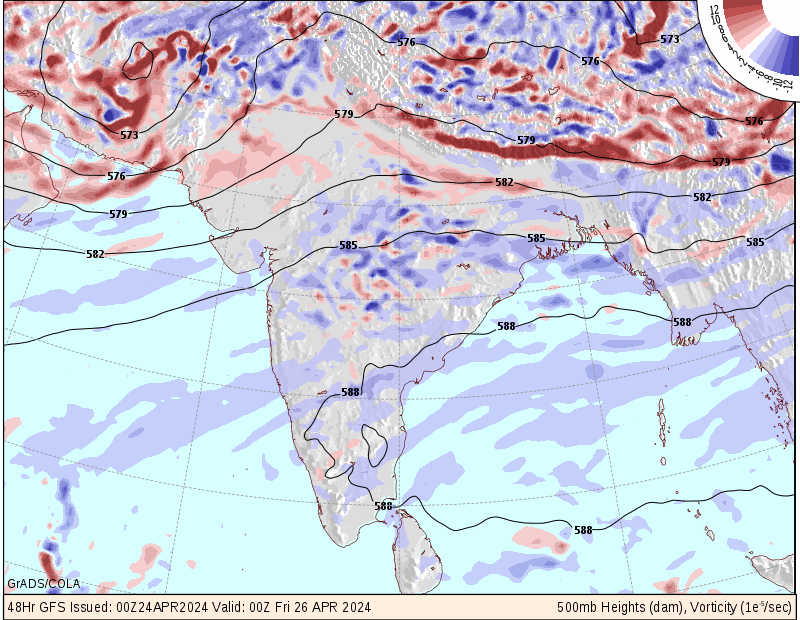
Fields
Fields
Fields
Fields
Fields
Fields
Fields
& Vorticity
Times


& 1000-500mb Thickness
Times


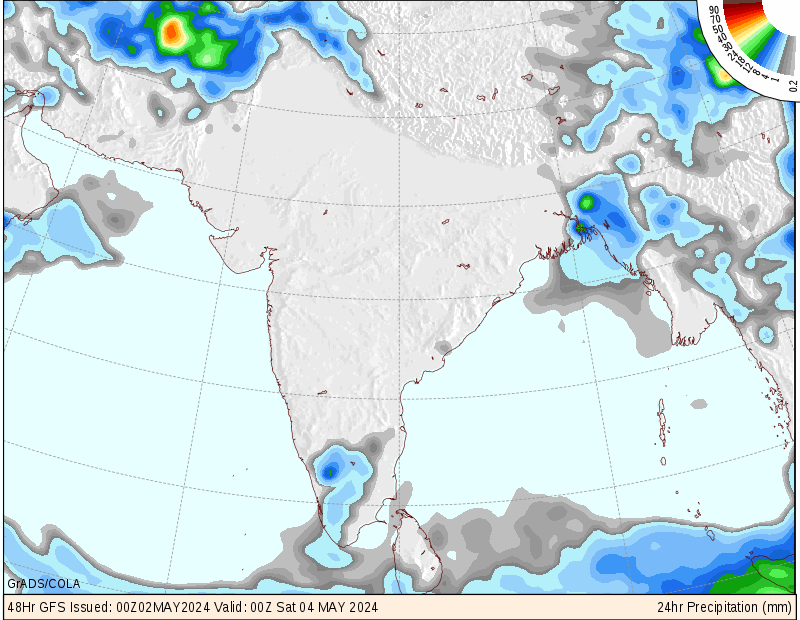
or Precipitation
Times


Relative Humidity & Winds
Times


& Isotachs
Times


Convective Available Potential Energy
Times


or Low, Middle, & High Cloud Cover
Times


