| Meteorological Analyses
and Forecasts An ensemble of images showing the current analyses and forecasts for several important meteorological variables: 500mb geopotential height and vorticity, sea level pressure, 1000 - 500mb thickness, 700mb vertical velocity, accumulated precipitation, 850 mb temperature, relative humidity and winds, 200 mb winds and divergence, precipitable water, and an atmospheric stability index. Forecast domain shown in image at right. |
 |
| Regional
Forecasts of Surface Temperature and Precipitation An ensemble of images showing daily forecasts of 2-meter temperature minima and maxima and accumulated precipitation covering four subregions of India. Forecasts are presented for four 24-hour periods, out to 96 hours. |
 |
|
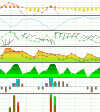
Forecast Meteograms Meteograms illustrate the forecasted evolution of weather conditions at a single location. Variables displayed in the meteogram include a time/height cross section of tropospheric temperature, winds, and relative humidity, 1000-500mb thickness, atmospheric stability indices, sea level pressure, 10m winds, 2m temperature and dew point, 2m relative humidity, soil moisture, runoff, and precipitation amount. |
 |
|
Climate Outlooks for Precipitation,
Temperature, and Soil
Moisture |
 |
| Please read the Disclaimer | Home Page |